Lalitpur District Population, Caste, Religion Data (Uttar Pradesh) - Census 2011
Lalitpur district of Uttar Pradesh has a total population of 1,221,592 as per the Census 2011. Out of which 641,011 are males while 580,581 are females. In 2011 there were a total 222,094 families residing in Lalitpur district. The Average Sex Ratio of Lalitpur district is 906.
As per Census 2011 out of total population, 14.4% people live in Urban areas while 85.6% live in the Rural areas. The average literacy rate in urban areas is 81.2% while that in rural areas is 60.4%. Also the Sex Ratio of Urban areas in Lalitpur district is 916 while that of Rural areas is 904.
The population of Children of age 0-6 years in Lalitpur district is 212205 which is 17% of the total population. There are 110745 male children and 101460 female children between the age 0-6 years. Thus as per the Census 2011 the Child Sex Ratio of Lalitpur is 916 which is greater than Average Sex Ratio (906) of Lalitpur district.
The total literacy rate of Lalitpur district is 63.52%. The male literacy rate is 62.02% and the female literacy rate is 41.96% in Lalitpur district.
To facilitate the administration, Lalitpur district is further divided into 3 Tehsils (Taluka/Tehsil/Tahsil) which are administrative divisions denoting sub-districts. Tehsils consists of multiple villages and a few towns.
Lalitpur Data as per Census 2011
As per the Population Census 2011 data, following are some quick facts about Lalitpur district.
| Total | Male | Female | |
|---|---|---|---|
| Children (Age 0-6) | 212,205 | 110,745 | 101,460 |
| Literacy | 63.52% | 62.02% | 41.96% |
| Scheduled Caste | 240,519 | 126,325 | 114,194 |
| Scheduled Tribe | 71,610 | 36,834 | 34,776 |
| Illiterate | 580,401 | 243,425 | 336,976 |
Caste-wise Population - Lalitpur district
Schedule Caste (SC) constitutes 19.7% while Schedule Tribe (ST) were 5.9% of total population in Lalitpur district of Uttar Pradesh.
| Total | Male | Female | |
|---|---|---|---|
| Schedule Caste | 240,519 | 126,325 | 114,194 |
| Schedule Tribe | 71,610 | 36,834 | 34,776 |
Religion-wise Population - Lalitpur district
| Religion | Total | Male | Female | |
|---|---|---|---|---|
| Hindu | 1,163,804 | (95.27%) | 610,970 | 552,834 |
| Muslim | 33,724 | (2.76%) | 17,388 | 16,336 |
| Christian | 1,351 | (0.11%) | 706 | 645 |
| Sikh | 1,034 | (0.08%) | 628 | 406 |
| Buddhist | 69 | (0.01%) | 37 | 32 |
| Jain | 20,390 | (1.67%) | 10,636 | 9,754 |
| Other Religion | 41 | (0%) | 29 | 12 |
| No Religion Specified | 1,179 | (0.1%) | 617 | 562 |
Literacy Rate - Lalitpur district
The total literacy rate of Lalitpur district was 63.52% in 2011 which is less than average literacy rate 67.68% of Uttar Pradesh. Population-wise, out of total 641,191 literates, males were 397,586 while females were 243,605. Also the male literacy rate was 74.98% and the female literacy rate was 50.84% in Lalitpur district.
| Lalitpur district | Uttar Pradesh | |
|---|---|---|
| Female | 50.84% | 57.18% |
| Male | 74.98% | 77.28% |
| Total | 63.52% | 67.68% |
Sex Ratio - Lalitpur district
The Sex Ratio of Lalitpur district is 906 . Thus for every 1000 men there were 906 females in Lalitpur district. Also as per Census 2011, the Child Sex Ration was 916 which is greater than Average Sex Ratio ( 906 ) of Lalitpur district.
Population Density - Lalitpur district
The total area of Lalitpur district is 5,039 km2. Thus the density of Lalitpur district is 242 people per square kilometer. As per the initial provisional data of Census 2011, around 41 sq. km. area is under urban region while 4,998 sq. km. is under rural region.
Urban/Rural Population - Lalitpur district
As per the Census 2011 out of total population of Lalitpur, 14.36% people lived in urban regions while 85.64% in rural areas. The total urban population was 175,378 out of which 91,533 were males while the remaining 83,845 were females. In rural areas of Lalitpur, male population was 549,478 while the female population was 496,736.
The average sex ratio in urban regions of Lalitpur was 916 females per 1000 males. Also the Child (0-6 age) sex ration of urban areas in Lalitpur was 918 girls per 1000 boys. Thus the total children (0-6 age) living in urban areas of Lalitpur were 22,928 which is 13.07% of total urban population. Similarly the average sex ratio in rural areas of Lalitpur was 904 females per 1000 males. The Child sex ratio of rural areas in Lalitpur was 916 girls per 1000 boys.
The average literacy rate in Lalitpur for urban regions was 81.18 percent in which males were 88.21% literate while female literacy stood at 73.51%. The total literate population of Lalitpur was 641,191. Similarly in rural areas of Lalitpur, the average literacy rate was 60.38 percent. Out of which the literacy rate of males and females stood at 72.64% and 46.78% respectively. Total literates in rural areas of Lalitpur were 517,428.
| Rural | Urban | |
|---|---|---|
| Population % | 85.64% | 14.36% |
| Total population | 1,046,214 | 175,378 |
| Male population | 549,478 | 91,533 |
| Female population | 496,736 | 83,845 |
| Sex ratio | 904 | 916 |
| Child sex ratio (0-6 age) | 916 | 918 |
| Child population | 189,277 | 22,928 |
| Literates | 517,428 | 123,763 |
| Average literacy | 60.38% | 81.18% |
| Male literacy | 72.64% | 88.21% |
| Female literacy | 46.78% | 73.51% |
Child Population - Lalitpur district
According to Census 2011, there were 212,205 children between age 0 to 6 years in Lalitpur district. Out of which 110,745 were male while 101,460 were female.
Working Population - Lalitpur district
In Lalitpur district out of total population, 503,351 were engaged in work activities. 70.9% of workers describe their work as Main Work (Employment or Earning more than 6 Months) while 29.1% were involved in Marginal activity providing livelihood for less than 6 months. Of 503,351 workers engaged in Main Work, 218,881 were cultivators (owner or co-owner) while 59,275 were Agricultural labourers.
| Total | Male | Female | |
|---|---|---|---|
| Main Workers | 357,033 | 278,499 | 78,534 |
| Cultivators | 218,881 | 176,701 | 42,180 |
| Agriculture Labourer | 59,275 | 37,953 | 21,322 |
| Household Industries | 9,238 | 6,260 | 2,978 |
| Other Workers | 69,639 | 57,585 | 12,054 |
| Marginal Workers | 146,318 | 48,284 | 98,034 |
| Non Working | 718,241 | 314,228 | 404,013 |
Nearby Districts from Lalitpur
Below are the list of Districts near Lalitpur district in Uttar Pradesh.
| District | Population |
|---|---|
| Jhansi district population | 1,998,603 |
| Hamirpur district population | 1,104,285 |
| Jalaun district population | 1,689,974 |
| Mahoba district population | 875,958 |
| Kanpur Nagar district population | 4,581,268 |
| Banda district population | 1,799,410 |
| Kanpur Dehat district population | 1,796,184 |
| Chitrakoot district population | 991,730 |
| Fatehpur district population | 2,632,733 |
| Auraiya district population | 1,379,545 |
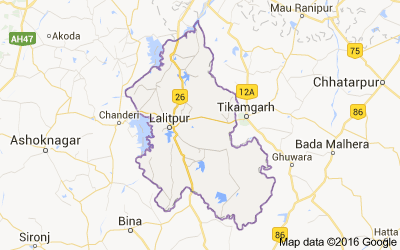
Lalitpur district Map
Reference
- Census 2011 Data - censusindia.gov.in
- Lalitpur, Uttar Pradesh - Wikipedia