Ballia District Population, Caste, Religion Data (Uttar Pradesh) - Census 2011
Ballia district of Uttar Pradesh has a total population of 3,239,774 as per the Census 2011. Out of which 1,672,902 are males while 1,566,872 are females. In 2011 there were a total 480,268 families residing in Ballia district. The Average Sex Ratio of Ballia district is 937.
As per Census 2011 out of total population, 9.4% people live in Urban areas while 90.6% live in the Rural areas. The average literacy rate in urban areas is 77.6% while that in rural areas is 70.2%. Also the Sex Ratio of Urban areas in Ballia district is 914 while that of Rural areas is 939.
The population of Children of age 0-6 years in Ballia district is 471852 which is 15% of the total population. There are 248293 male children and 223559 female children between the age 0-6 years. Thus as per the Census 2011 the Child Sex Ratio of Ballia is 900 which is less than Average Sex Ratio (937) of Ballia district.
The total literacy rate of Ballia district is 70.94%. The male literacy rate is 69.4% and the female literacy rate is 51.22% in Ballia district.
To facilitate the administration, Ballia district is further divided into 6 Tehsils (Taluka/Tehsil/Tahsil) which are administrative divisions denoting sub-districts. Tehsils consists of multiple villages and a few towns.
Ballia Data as per Census 2011
As per the Population Census 2011 data, following are some quick facts about Ballia district.
| Total | Male | Female | |
|---|---|---|---|
| Children (Age 0-6) | 471,852 | 248,293 | 223,559 |
| Literacy | 70.94% | 69.4% | 51.22% |
| Scheduled Caste | 494,698 | 257,624 | 237,074 |
| Scheduled Tribe | 110,114 | 56,817 | 53,297 |
| Illiterate | 1,276,184 | 511,942 | 764,242 |
Caste-wise Population - Ballia district
Schedule Caste (SC) constitutes 15.3% while Schedule Tribe (ST) were 3.4% of total population in Ballia district of Uttar Pradesh.
| Total | Male | Female | |
|---|---|---|---|
| Schedule Caste | 494,698 | 257,624 | 237,074 |
| Schedule Tribe | 110,114 | 56,817 | 53,297 |
Religion-wise Population - Ballia district
| Religion | Total | Male | Female | |
|---|---|---|---|---|
| Hindu | 3,004,240 | (92.73%) | 1,552,387 | 1,451,853 |
| Muslim | 213,440 | (6.59%) | 108,950 | 104,490 |
| Christian | 4,463 | (0.14%) | 2,390 | 2,073 |
| Sikh | 892 | (0.03%) | 478 | 414 |
| Buddhist | 1,595 | (0.05%) | 826 | 769 |
| Jain | 233 | (0.01%) | 114 | 119 |
| Other Religion | 64 | (0%) | 35 | 29 |
| No Religion Specified | 14,847 | (0.46%) | 7,722 | 7,125 |
Literacy Rate - Ballia district
The total literacy rate of Ballia district was 70.94% in 2011 which is greater than average literacy rate 67.68% of Uttar Pradesh. Population-wise, out of total 1,963,590 literates, males were 1,160,960 while females were 802,630. Also the male literacy rate was 81.49% and the female literacy rate was 59.75% in Ballia district.
| Ballia district | Uttar Pradesh | |
|---|---|---|
| Female | 59.75% | 57.18% |
| Male | 81.49% | 77.28% |
| Total | 70.94% | 67.68% |
Sex Ratio - Ballia district
The Sex Ratio of Ballia district is 937 . Thus for every 1000 men there were 937 females in Ballia district. Also as per Census 2011, the Child Sex Ration was 900 which is less than Average Sex Ratio ( 937 ) of Ballia district.
Population Density - Ballia district
The total area of Ballia district is 2,981 km2. Thus the density of Ballia district is 1,087 people per square kilometer. As per the initial provisional data of Census 2011, around 68 sq. km. area is under urban region while 2,913 sq. km. is under rural region.
Urban/Rural Population - Ballia district
As per the Census 2011 out of total population of Ballia, 9.39% people lived in urban regions while 90.61% in rural areas. The total urban population was 304,109 out of which 158,884 were males while the remaining 145,225 were females. In rural areas of Ballia, male population was 1,514,018 while the female population was 1,421,647.
The average sex ratio in urban regions of Ballia was 914 females per 1000 males. Also the Child (0-6 age) sex ration of urban areas in Ballia was 893 girls per 1000 boys. Thus the total children (0-6 age) living in urban areas of Ballia were 39,908 which is 13.12% of total urban population. Similarly the average sex ratio in rural areas of Ballia was 939 females per 1000 males. The Child sex ratio of rural areas in Ballia was 901 girls per 1000 boys.
The average literacy rate in Ballia for urban regions was 77.58 percent in which males were 84.13% literate while female literacy stood at 70.43%. The total literate population of Ballia was 1,963,590. Similarly in rural areas of Ballia, the average literacy rate was 70.24 percent. Out of which the literacy rate of males and females stood at 81.21% and 58.64% respectively. Total literates in rural areas of Ballia were 1,758,635.
| Rural | Urban | |
|---|---|---|
| Population % | 90.61% | 9.39% |
| Total population | 2,935,665 | 304,109 |
| Male population | 1,514,018 | 158,884 |
| Female population | 1,421,647 | 145,225 |
| Sex ratio | 939 | 914 |
| Child sex ratio (0-6 age) | 901 | 893 |
| Child population | 431,944 | 39,908 |
| Literates | 1,758,635 | 204,955 |
| Average literacy | 70.24% | 77.58% |
| Male literacy | 81.21% | 84.13% |
| Female literacy | 58.64% | 70.43% |
Child Population - Ballia district
According to Census 2011, there were 471,852 children between age 0 to 6 years in Ballia district. Out of which 248,293 were male while 223,559 were female.
Working Population - Ballia district
In Ballia district out of total population, 1,019,483 were engaged in work activities. 55.9% of workers describe their work as Main Work (Employment or Earning more than 6 Months) while 44.1% were involved in Marginal activity providing livelihood for less than 6 months. Of 1,019,483 workers engaged in Main Work, 153,930 were cultivators (owner or co-owner) while 161,192 were Agricultural labourers.
| Total | Male | Female | |
|---|---|---|---|
| Main Workers | 569,522 | 445,393 | 124,129 |
| Cultivators | 153,930 | 129,503 | 24,427 |
| Agriculture Labourer | 161,192 | 119,725 | 41,467 |
| Household Industries | 38,130 | 25,852 | 12,278 |
| Other Workers | 216,270 | 170,313 | 45,957 |
| Marginal Workers | 449,961 | 277,667 | 172,294 |
| Non Working | 2,220,291 | 949,842 | 1,270,449 |
Nearby Districts from Ballia
Below are the list of Districts near Ballia district in Uttar Pradesh.
| District | Population |
|---|---|
| Jaunpur district population | 4,494,204 |
| Mau district population | 2,205,968 |
| Azamgarh district population | 4,613,913 |
| Ghazipur district population | 3,620,268 |
| Deoria district population | 3,100,946 |
| Chandauli district population | 1,952,756 |
| Varanasi district population | 3,676,841 |
| Kushinagar district population | 3,564,544 |
| Gorakhpur district population | 4,440,895 |
| Sant Ravidas Nagar district population | 1,578,213 |
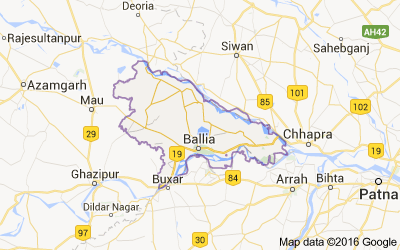
Ballia district Map
Reference
- Census 2011 Data - censusindia.gov.in
- Ballia, Uttar Pradesh - Wikipedia