Bhilwara District Population, Caste, Religion Data (Rajasthan) - Census 2011
Bhilwara district of Rajasthan has a total population of 2,408,523 as per the Census 2011. Out of which 1,220,736 are males while 1,187,787 are females. In 2011 there were a total 498,125 families residing in Bhilwara district. The Average Sex Ratio of Bhilwara district is 973.
As per Census 2011 out of total population, 21.3% people live in Urban areas while 78.7% live in the Rural areas. The average literacy rate in urban areas is 80.7% while that in rural areas is 56%. Also the Sex Ratio of Urban areas in Bhilwara district is 932 while that of Rural areas is 984.
The population of Children of age 0-6 years in Bhilwara district is 361683 which is 15% of the total population. There are 187617 male children and 174066 female children between the age 0-6 years. Thus as per the Census 2011 the Child Sex Ratio of Bhilwara is 928 which is less than Average Sex Ratio (973) of Bhilwara district.
The total literacy rate of Bhilwara district is 61.37%. The male literacy rate is 63.7% and the female literacy rate is 40.29% in Bhilwara district.
To facilitate the administration, Bhilwara district is further divided into 12 Tehsils (Taluka/Tehsil/Tahsil) which are administrative divisions denoting sub-districts. Tehsils consists of multiple villages and a few towns.
Bhilwara Data as per Census 2011
As per the Population Census 2011 data, following are some quick facts about Bhilwara district.
| Total | Male | Female | |
|---|---|---|---|
| Children (Age 0-6) | 361,683 | 187,617 | 174,066 |
| Literacy | 61.37% | 63.7% | 40.29% |
| Scheduled Caste | 407,947 | 206,332 | 201,615 |
| Scheduled Tribe | 229,273 | 117,026 | 112,247 |
| Illiterate | 1,152,397 | 443,154 | 709,243 |
Caste-wise Population - Bhilwara district
Schedule Caste (SC) constitutes 16.9% while Schedule Tribe (ST) were 9.5% of total population in Bhilwara district of Rajasthan.
| Total | Male | Female | |
|---|---|---|---|
| Schedule Caste | 407,947 | 206,332 | 201,615 |
| Schedule Tribe | 229,273 | 117,026 | 112,247 |
Religion-wise Population - Bhilwara district
| Religion | Total | Male | Female | |
|---|---|---|---|---|
| Hindu | 2,224,839 | (92.37%) | 1,127,007 | 1,097,832 |
| Muslim | 142,427 | (5.91%) | 72,770 | 69,657 |
| Christian | 1,978 | (0.08%) | 1,006 | 972 |
| Sikh | 1,468 | (0.06%) | 744 | 724 |
| Buddhist | 183 | (0.01%) | 83 | 100 |
| Jain | 35,149 | (1.46%) | 17,775 | 17,374 |
| Other Religion | 60 | (0%) | 29 | 31 |
| No Religion Specified | 2,419 | (0.1%) | 1,322 | 1,097 |
Literacy Rate - Bhilwara district
The total literacy rate of Bhilwara district was 61.37% in 2011 which is less than average literacy rate 66.11% of Rajasthan. Population-wise, out of total 1,256,126 literates, males were 777,582 while females were 478,544. Also the male literacy rate was 75.27% and the female literacy rate was 47.21% in Bhilwara district.
| Bhilwara district | Rajasthan | |
|---|---|---|
| Female | 47.21% | 52.12% |
| Male | 75.27% | 79.19% |
| Total | 61.37% | 66.11% |
Sex Ratio - Bhilwara district
The Sex Ratio of Bhilwara district is 973 . Thus for every 1000 men there were 973 females in Bhilwara district. Also as per Census 2011, the Child Sex Ration was 928 which is less than Average Sex Ratio ( 973 ) of Bhilwara district.
Population Density - Bhilwara district
The total area of Bhilwara district is 10,455 km2. Thus the density of Bhilwara district is 230 people per square kilometer. As per the initial provisional data of Census 2011, around 311 sq. km. area is under urban region while 10,144 sq. km. is under rural region.
Urban/Rural Population - Bhilwara district
As per the Census 2011 out of total population of Bhilwara, 21.28% people lived in urban regions while 78.72% in rural areas. The total urban population was 512,654 out of which 265,358 were males while the remaining 247,296 were females. In rural areas of Bhilwara, male population was 955,378 while the female population was 940,491.
The average sex ratio in urban regions of Bhilwara was 932 females per 1000 males. Also the Child (0-6 age) sex ration of urban areas in Bhilwara was 904 girls per 1000 boys. Thus the total children (0-6 age) living in urban areas of Bhilwara were 67,551 which is 13.18% of total urban population. Similarly the average sex ratio in rural areas of Bhilwara was 984 females per 1000 males. The Child sex ratio of rural areas in Bhilwara was 933 girls per 1000 boys.
The average literacy rate in Bhilwara for urban regions was 80.7 percent in which males were 89.04% literate while female literacy stood at 71.79%. The total literate population of Bhilwara was 1,256,126. Similarly in rural areas of Bhilwara, the average literacy rate was 56 percent. Out of which the literacy rate of males and females stood at 71.32% and 40.58% respectively. Total literates in rural areas of Bhilwara were 896,937.
| Rural | Urban | |
|---|---|---|
| Population % | 78.72% | 21.28% |
| Total population | 1,895,869 | 512,654 |
| Male population | 955,378 | 265,358 |
| Female population | 940,491 | 247,296 |
| Sex ratio | 984 | 932 |
| Child sex ratio (0-6 age) | 933 | 904 |
| Child population | 294,132 | 67,551 |
| Literates | 896,937 | 359,189 |
| Average literacy | 56% | 80.7% |
| Male literacy | 71.32% | 89.04% |
| Female literacy | 40.58% | 71.79% |
Child Population - Bhilwara district
According to Census 2011, there were 361,683 children between age 0 to 6 years in Bhilwara district. Out of which 187,617 were male while 174,066 were female.
Working Population - Bhilwara district
In Bhilwara district out of total population, 1,148,165 were engaged in work activities. 76.9% of workers describe their work as Main Work (Employment or Earning more than 6 Months) while 23.1% were involved in Marginal activity providing livelihood for less than 6 months. Of 1,148,165 workers engaged in Main Work, 461,822 were cultivators (owner or co-owner) while 77,499 were Agricultural labourers.
| Total | Male | Female | |
|---|---|---|---|
| Main Workers | 883,329 | 581,039 | 302,290 |
| Cultivators | 461,822 | 260,882 | 200,940 |
| Agriculture Labourer | 77,499 | 36,559 | 40,940 |
| Household Industries | 21,262 | 15,486 | 5,776 |
| Other Workers | 322,746 | 268,112 | 54,634 |
| Marginal Workers | 264,836 | 93,550 | 171,286 |
| Non Working | 1,260,358 | 546,147 | 714,211 |
Nearby Districts from Bhilwara
Below are the list of Districts near Bhilwara district in Rajasthan.
| District | Population |
|---|---|
| Rajsamand district population | 1,156,597 |
| Bundi district population | 1,110,906 |
| Tonk district population | 1,421,326 |
| Dungarpur district population | 1,388,552 |
| Ajmer district population | 2,583,052 |
| Banswara district population | 1,797,485 |
| Pali district population | 2,037,573 |
| Chittaurgarh district population | 1,544,338 |
| Kota district population | 1,951,014 |
| Sirohi district population | 1,036,346 |
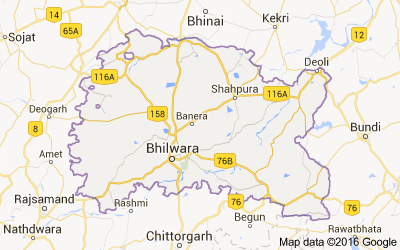
Bhilwara district Map
Reference
- Census 2011 Data - censusindia.gov.in
- Bhilwara, Rajasthan - Wikipedia