Chatra District Population, Caste, Religion Data (Jharkhand) - Census 2011
Chatra district of Jharkhand has a total population of 1,042,886 as per the Census 2011. Out of which 533,935 are males while 508,951 are females. In 2011 there were a total 182,271 families residing in Chatra district. The Average Sex Ratio of Chatra district is 953.
As per Census 2011 out of total population, 6% people live in Urban areas while 94% live in the Rural areas. The average literacy rate in urban areas is 80.9% while that in rural areas is 58.8%. Also the Sex Ratio of Urban areas in Chatra district is 867 while that of Rural areas is 959.
The population of Children of age 0-6 years in Chatra district is 195321 which is 19% of the total population. There are 99312 male children and 96009 female children between the age 0-6 years. Thus as per the Census 2011 the Child Sex Ratio of Chatra is 967 which is greater than Average Sex Ratio (953) of Chatra district.
The total literacy rate of Chatra district is 60.18%. The male literacy rate is 56.92% and the female literacy rate is 40.51% in Chatra district.
To facilitate the administration, Chatra district is further divided into 12 Blocks (Taluka/Tehsil/Tahsil) which are administrative divisions denoting sub-districts. Blocks consists of multiple villages and a few towns.
Chatra Data as per Census 2011
As per the Population Census 2011 data, following are some quick facts about Chatra district.
| Total | Male | Female | |
|---|---|---|---|
| Children (Age 0-6) | 195,321 | 99,312 | 96,009 |
| Literacy | 60.18% | 56.92% | 40.51% |
| Scheduled Caste | 340,553 | 172,668 | 167,885 |
| Scheduled Tribe | 45,563 | 23,141 | 22,422 |
| Illiterate | 532,825 | 230,033 | 302,792 |
Caste-wise Population - Chatra district
Schedule Caste (SC) constitutes 32.7% while Schedule Tribe (ST) were 4.4% of total population in Chatra district of Jharkhand.
| Total | Male | Female | |
|---|---|---|---|
| Schedule Caste | 340,553 | 172,668 | 167,885 |
| Schedule Tribe | 45,563 | 23,141 | 22,422 |
Religion-wise Population - Chatra district
| Religion | Total | Male | Female | |
|---|---|---|---|---|
| Hindu | 903,179 | (86.6%) | 462,671 | 440,508 |
| Muslim | 116,710 | (11.19%) | 59,649 | 57,061 |
| Christian | 6,565 | (0.63%) | 3,235 | 3,330 |
| Sikh | 888 | (0.09%) | 465 | 423 |
| Buddhist | 35 | (0%) | 19 | 16 |
| Jain | 129 | (0.01%) | 69 | 60 |
| Other Religion | 12,936 | (1.24%) | 6,480 | 6,456 |
| No Religion Specified | 2,444 | (0.23%) | 1,347 | 1,097 |
Literacy Rate - Chatra district
The total literacy rate of Chatra district was 60.18% in 2011 which is less than average literacy rate 66.41% of Jharkhand. Population-wise, out of total 510,061 literates, males were 303,902 while females were 206,159. Also the male literacy rate was 69.92% and the female literacy rate was 49.92% in Chatra district.
| Chatra district | Jharkhand | |
|---|---|---|
| Female | 49.92% | 55.42% |
| Male | 69.92% | 76.84% |
| Total | 60.18% | 66.41% |
Sex Ratio - Chatra district
The Sex Ratio of Chatra district is 953 . Thus for every 1000 men there were 953 females in Chatra district. Also as per Census 2011, the Child Sex Ration was 967 which is greater than Average Sex Ratio ( 953 ) of Chatra district.
Population Density - Chatra district
The total area of Chatra district is 3,718 km2. Thus the density of Chatra district is 280 people per square kilometer. As per the initial provisional data of Census 2011, around 33 sq. km. area is under urban region while 3,685 sq. km. is under rural region.
Urban/Rural Population - Chatra district
As per the Census 2011 out of total population of Chatra, 6.04% people lived in urban regions while 93.96% in rural areas. The total urban population was 62,954 out of which 33,724 were males while the remaining 29,230 were females. In rural areas of Chatra, male population was 500,211 while the female population was 479,721.
The average sex ratio in urban regions of Chatra was 867 females per 1000 males. Also the Child (0-6 age) sex ration of urban areas in Chatra was 939 girls per 1000 boys. Thus the total children (0-6 age) living in urban areas of Chatra were 9,253 which is 14.7% of total urban population. Similarly the average sex ratio in rural areas of Chatra was 959 females per 1000 males. The Child sex ratio of rural areas in Chatra was 968 girls per 1000 boys.
The average literacy rate in Chatra for urban regions was 80.94 percent in which males were 86.89% literate while female literacy stood at 73.97%. The total literate population of Chatra was 510,061. Similarly in rural areas of Chatra, the average literacy rate was 58.78 percent. Out of which the literacy rate of males and females stood at 68.71% and 48.39% respectively. Total literates in rural areas of Chatra were 466,597.
| Rural | Urban | |
|---|---|---|
| Population % | 93.96% | 6.04% |
| Total population | 979,932 | 62,954 |
| Male population | 500,211 | 33,724 |
| Female population | 479,721 | 29,230 |
| Sex ratio | 959 | 867 |
| Child sex ratio (0-6 age) | 968 | 939 |
| Child population | 186,068 | 9,253 |
| Literates | 466,597 | 43,464 |
| Average literacy | 58.78% | 80.94% |
| Male literacy | 68.71% | 86.89% |
| Female literacy | 48.39% | 73.97% |
Child Population - Chatra district
According to Census 2011, there were 195,321 children between age 0 to 6 years in Chatra district. Out of which 99,312 were male while 96,009 were female.
Working Population - Chatra district
In Chatra district out of total population, 397,690 were engaged in work activities. 49.2% of workers describe their work as Main Work (Employment or Earning more than 6 Months) while 50.8% were involved in Marginal activity providing livelihood for less than 6 months. Of 397,690 workers engaged in Main Work, 75,717 were cultivators (owner or co-owner) while 63,773 were Agricultural labourers.
| Total | Male | Female | |
|---|---|---|---|
| Main Workers | 195,502 | 145,553 | 49,949 |
| Cultivators | 75,717 | 56,865 | 18,852 |
| Agriculture Labourer | 63,773 | 43,233 | 20,540 |
| Household Industries | 6,073 | 4,051 | 2,022 |
| Other Workers | 49,939 | 41,404 | 8,535 |
| Marginal Workers | 202,188 | 105,660 | 96,528 |
| Non Working | 645,196 | 282,722 | 362,474 |
Nearby Districts from Chatra
Below are the list of Districts near Chatra district in Jharkhand.
| District | Population |
|---|---|
| Garhwa district population | 1,322,784 |
| Kodarma district population | 716,259 |
| Giridih district population | 2,445,474 |
| Deoghar district population | 1,492,073 |
| Godda district population | 1,313,551 |
| Sahibganj district population | 1,150,567 |
| Pakur district population | 900,422 |
| Dhanbad district population | 2,684,487 |
| Bokaro district population | 2,062,330 |
| Lohardaga district population | 461,790 |
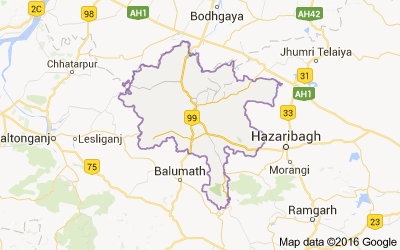
Chatra district Map
Reference
- Census 2011 Data - censusindia.gov.in
- Chatra, Jharkhand - Wikipedia