Dindigul District Population, Caste, Religion Data (Tamil Nadu) - Census 2011
Dindigul district of Tamil Nadu has a total population of 2,159,775 as per the Census 2011. Out of which 1,080,938 are males while 1,078,837 are females. In 2011 there were a total 560,773 families residing in Dindigul district. The Average Sex Ratio of Dindigul district is 998.
As per Census 2011 out of total population, 37.4% people live in Urban areas while 62.6% live in the Rural areas. The average literacy rate in urban areas is 83.9% while that in rural areas is 71.7%. Also the Sex Ratio of Urban areas in Dindigul district is 1,008 while that of Rural areas is 992.
The population of Children of age 0-6 years in Dindigul district is 216576 which is 10% of the total population. There are 111955 male children and 104621 female children between the age 0-6 years. Thus as per the Census 2011 the Child Sex Ratio of Dindigul is 934 which is less than Average Sex Ratio (998) of Dindigul district.
The total literacy rate of Dindigul district is 76.26%. The male literacy rate is 75.51% and the female literacy rate is 61.7% in Dindigul district.
To facilitate the administration, Dindigul district is further divided into 8 Talukas (Taluka/Tehsil/Tahsil) which are administrative divisions denoting sub-districts. Talukas consists of multiple villages and a few towns.
Dindigul Data as per Census 2011
As per the Population Census 2011 data, following are some quick facts about Dindigul district.
| Total | Male | Female | |
|---|---|---|---|
| Children (Age 0-6) | 216,576 | 111,955 | 104,621 |
| Literacy | 76.26% | 75.51% | 61.7% |
| Scheduled Caste | 452,376 | 225,573 | 226,803 |
| Scheduled Tribe | 8,064 | 4,095 | 3,969 |
| Illiterate | 677,941 | 264,758 | 413,183 |
Caste-wise Population - Dindigul district
Schedule Caste (SC) constitutes 20.9% while Schedule Tribe (ST) were 0.4% of total population in Dindigul district of Tamil Nadu.
| Total | Male | Female | |
|---|---|---|---|
| Schedule Caste | 452,376 | 225,573 | 226,803 |
| Schedule Tribe | 8,064 | 4,095 | 3,969 |
Religion-wise Population - Dindigul district
| Religion | Total | Male | Female | |
|---|---|---|---|---|
| Hindu | 1,879,494 | (87.02%) | 942,472 | 937,022 |
| Muslim | 105,012 | (4.86%) | 52,376 | 52,636 |
| Christian | 169,945 | (7.87%) | 83,394 | 86,551 |
| Sikh | 313 | (0.01%) | 172 | 141 |
| Buddhist | 256 | (0.01%) | 115 | 141 |
| Jain | 71 | (0%) | 25 | 46 |
| Other Religion | 138 | (0.01%) | 66 | 72 |
| No Religion Specified | 4,546 | (0.21%) | 2,318 | 2,228 |
Literacy Rate - Dindigul district
The total literacy rate of Dindigul district was 76.26% in 2011 which is less than average literacy rate 80.09% of Tamil Nadu. Population-wise, out of total 1,481,834 literates, males were 816,180 while females were 665,654. Also the male literacy rate was 84.23% and the female literacy rate was 68.33% in Dindigul district.
| Dindigul district | Tamil Nadu | |
|---|---|---|
| Female | 68.33% | 73.44% |
| Male | 84.23% | 86.77% |
| Total | 76.26% | 80.09% |
Sex Ratio - Dindigul district
The Sex Ratio of Dindigul district is 998 . Thus for every 1000 men there were 998 females in Dindigul district. Also as per Census 2011, the Child Sex Ration was 934 which is less than Average Sex Ratio ( 998 ) of Dindigul district.
Population Density - Dindigul district
The total area of Dindigul district is 6,036 km2. Thus the density of Dindigul district is 358 people per square kilometer. As per the initial provisional data of Census 2011, around 563 sq. km. area is under urban region while 5,473 sq. km. is under rural region.
Urban/Rural Population - Dindigul district
As per the Census 2011 out of total population of Dindigul, 37.41% people lived in urban regions while 62.59% in rural areas. The total urban population was 808,040 out of which 402,333 were males while the remaining 405,707 were females. In rural areas of Dindigul, male population was 678,605 while the female population was 673,130.
The average sex ratio in urban regions of Dindigul was 1,008 females per 1000 males. Also the Child (0-6 age) sex ration of urban areas in Dindigul was 949 girls per 1000 boys. Thus the total children (0-6 age) living in urban areas of Dindigul were 79,037 which is 9.78% of total urban population. Similarly the average sex ratio in rural areas of Dindigul was 992 females per 1000 males. The Child sex ratio of rural areas in Dindigul was 926 girls per 1000 boys.
The average literacy rate in Dindigul for urban regions was 83.89 percent in which males were 89.68% literate while female literacy stood at 78.19%. The total literate population of Dindigul was 1,481,834. Similarly in rural areas of Dindigul, the average literacy rate was 71.67 percent. Out of which the literacy rate of males and females stood at 80.98% and 62.36% respectively. Total literates in rural areas of Dindigul were 870,271.
| Rural | Urban | |
|---|---|---|
| Population % | 62.59% | 37.41% |
| Total population | 1,351,735 | 808,040 |
| Male population | 678,605 | 402,333 |
| Female population | 673,130 | 405,707 |
| Sex ratio | 992 | 1,008 |
| Child sex ratio (0-6 age) | 926 | 949 |
| Child population | 137,539 | 79,037 |
| Literates | 870,271 | 611,563 |
| Average literacy | 71.67% | 83.89% |
| Male literacy | 80.98% | 89.68% |
| Female literacy | 62.36% | 78.19% |
Child Population - Dindigul district
According to Census 2011, there were 216,576 children between age 0 to 6 years in Dindigul district. Out of which 111,955 were male while 104,621 were female.
Working Population - Dindigul district
In Dindigul district out of total population, 1,105,155 were engaged in work activities. 87.1% of workers describe their work as Main Work (Employment or Earning more than 6 Months) while 12.9% were involved in Marginal activity providing livelihood for less than 6 months. Of 1,105,155 workers engaged in Main Work, 155,332 were cultivators (owner or co-owner) while 388,725 were Agricultural labourers.
| Total | Male | Female | |
|---|---|---|---|
| Main Workers | 963,017 | 599,831 | 363,186 |
| Cultivators | 155,332 | 94,077 | 61,255 |
| Agriculture Labourer | 388,725 | 197,183 | 191,542 |
| Household Industries | 25,253 | 13,405 | 11,848 |
| Other Workers | 393,707 | 295,166 | 98,541 |
| Marginal Workers | 142,138 | 65,638 | 76,500 |
| Non Working | 1,054,620 | 415,469 | 639,151 |
Nearby Districts from Dindigul
Below are the list of Districts near Dindigul district in Tamil Nadu.
| District | Population |
|---|---|
| Karur district population | 1,064,493 |
| The Nilgiris district population | 735,394 |
| Tiruchirappalli district population | 2,722,290 |
| Erode district population | 2,251,744 |
| Namakkal district population | 1,726,601 |
| Perambalur district population | 565,223 |
| Salem district population | 3,482,056 |
| Ariyalur district population | 754,894 |
| Viluppuram district population | 3,458,873 |
| Cuddalore district population | 2,605,914 |
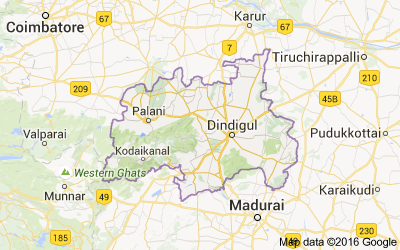
Dindigul district Map
Reference
- Census 2011 Data - censusindia.gov.in
- Dindigul, Tamil Nadu - Wikipedia