Jhabua District Population, Caste, Religion Data (Madhya Pradesh) - Census 2011
Jhabua district of Madhya Pradesh has a total population of 1,025,048 as per the Census 2011. Out of which 515,023 are males while 510,025 are females. In 2011 there were a total 194,157 families residing in Jhabua district. The Average Sex Ratio of Jhabua district is 990.
As per Census 2011 out of total population, 9% people live in Urban areas while 91% live in the Rural areas. The average literacy rate in urban areas is 83.5% while that in rural areas is 39%. Also the Sex Ratio of Urban areas in Jhabua district is 934 while that of Rural areas is 996.
The population of Children of age 0-6 years in Jhabua district is 211869 which is 21% of the total population. There are 109040 male children and 102829 female children between the age 0-6 years. Thus as per the Census 2011 the Child Sex Ratio of Jhabua is 943 which is less than Average Sex Ratio (990) of Jhabua district.
The total literacy rate of Jhabua district is 43.3%. The male literacy rate is 41.66% and the female literacy rate is 26.96% in Jhabua district.
To facilitate the administration, Jhabua district is further divided into 5 Tehsils (Taluka/Tehsil/Tahsil) which are administrative divisions denoting sub-districts. Tehsils consists of multiple villages and a few towns.
Jhabua Data as per Census 2011
As per the Population Census 2011 data, following are some quick facts about Jhabua district.
| Total | Male | Female | |
|---|---|---|---|
| Children (Age 0-6) | 211,869 | 109,040 | 102,829 |
| Literacy | 43.3% | 41.66% | 26.96% |
| Scheduled Caste | 17,427 | 8,770 | 8,657 |
| Scheduled Tribe | 891,818 | 446,359 | 445,459 |
| Illiterate | 672,967 | 300,441 | 372,526 |
Caste-wise Population - Jhabua district
Schedule Caste (SC) constitutes 1.7% while Schedule Tribe (ST) were 87% of total population in Jhabua district of Madhya Pradesh.
| Total | Male | Female | |
|---|---|---|---|
| Schedule Caste | 17,427 | 8,770 | 8,657 |
| Schedule Tribe | 891,818 | 446,359 | 445,459 |
Religion-wise Population - Jhabua district
| Religion | Total | Male | Female | |
|---|---|---|---|---|
| Hindu | 960,925 | (93.74%) | 482,494 | 478,431 |
| Muslim | 15,733 | (1.53%) | 8,306 | 7,427 |
| Christian | 38,423 | (3.75%) | 19,168 | 19,255 |
| Sikh | 141 | (0.01%) | 78 | 63 |
| Buddhist | 65 | (0.01%) | 31 | 34 |
| Jain | 8,871 | (0.87%) | 4,486 | 4,385 |
| Other Religion | 388 | (0.04%) | 188 | 200 |
| No Religion Specified | 502 | (0.05%) | 272 | 230 |
Literacy Rate - Jhabua district
The total literacy rate of Jhabua district was 43.3% in 2011 which is less than average literacy rate 69.32% of Madhya Pradesh. Population-wise, out of total 352,081 literates, males were 214,582 while females were 137,499. Also the male literacy rate was 52.85% and the female literacy rate was 33.77% in Jhabua district.
| Jhabua district | Madhya Pradesh | |
|---|---|---|
| Female | 33.77% | 59.24% |
| Male | 52.85% | 78.73% |
| Total | 43.3% | 69.32% |
Sex Ratio - Jhabua district
The Sex Ratio of Jhabua district is 990 . Thus for every 1000 men there were 990 females in Jhabua district. Also as per Census 2011, the Child Sex Ration was 943 which is less than Average Sex Ratio ( 990 ) of Jhabua district.
Population Density - Jhabua district
The total area of Jhabua district is 3,600 km2. Thus the density of Jhabua district is 285 people per square kilometer. As per the initial provisional data of Census 2011, around 31 sq. km. area is under urban region while 3,569 sq. km. is under rural region.
Urban/Rural Population - Jhabua district
As per the Census 2011 out of total population of Jhabua, 8.97% people lived in urban regions while 91.03% in rural areas. The total urban population was 91,983 out of which 47,555 were males while the remaining 44,428 were females. In rural areas of Jhabua, male population was 467,468 while the female population was 465,597.
The average sex ratio in urban regions of Jhabua was 934 females per 1000 males. Also the Child (0-6 age) sex ration of urban areas in Jhabua was 921 girls per 1000 boys. Thus the total children (0-6 age) living in urban areas of Jhabua were 13,115 which is 14.26% of total urban population. Similarly the average sex ratio in rural areas of Jhabua was 996 females per 1000 males. The Child sex ratio of rural areas in Jhabua was 944 girls per 1000 boys.
The average literacy rate in Jhabua for urban regions was 83.49 percent in which males were 89.86% literate while female literacy stood at 76.69%. The total literate population of Jhabua was 352,081. Similarly in rural areas of Jhabua, the average literacy rate was 38.98 percent. Out of which the literacy rate of males and females stood at 48.73% and 29.33% respectively. Total literates in rural areas of Jhabua were 286,231.
| Rural | Urban | |
|---|---|---|
| Population % | 91.03% | 8.97% |
| Total population | 933,065 | 91,983 |
| Male population | 467,468 | 47,555 |
| Female population | 465,597 | 44,428 |
| Sex ratio | 996 | 934 |
| Child sex ratio (0-6 age) | 944 | 921 |
| Child population | 198,754 | 13,115 |
| Literates | 286,231 | 65,850 |
| Average literacy | 38.98% | 83.49% |
| Male literacy | 48.73% | 89.86% |
| Female literacy | 29.33% | 76.69% |
Child Population - Jhabua district
According to Census 2011, there were 211,869 children between age 0 to 6 years in Jhabua district. Out of which 109,040 were male while 102,829 were female.
Working Population - Jhabua district
In Jhabua district out of total population, 515,121 were engaged in work activities. 72% of workers describe their work as Main Work (Employment or Earning more than 6 Months) while 28% were involved in Marginal activity providing livelihood for less than 6 months. Of 515,121 workers engaged in Main Work, 267,795 were cultivators (owner or co-owner) while 48,469 were Agricultural labourers.
| Total | Male | Female | |
|---|---|---|---|
| Main Workers | 370,641 | 211,155 | 159,486 |
| Cultivators | 267,795 | 150,773 | 117,022 |
| Agriculture Labourer | 48,469 | 19,982 | 28,487 |
| Household Industries | 3,573 | 2,324 | 1,249 |
| Other Workers | 50,804 | 38,076 | 12,728 |
| Marginal Workers | 144,480 | 54,334 | 90,146 |
| Non Working | 509,927 | 249,534 | 260,393 |
Nearby Districts from Jhabua
Below are the list of Districts near Jhabua district in Madhya Pradesh.
| District | Population |
|---|---|
| Singrauli district population | 1,178,273 |
| Alirajpur district population | 728,999 |
| Khandwa district population | 1,310,061 |
| Sidhi district population | 1,127,033 |
| Burhanpur district population | 757,847 |
| Anuppur district population | 749,237 |
| Shahdol district population | 1,066,063 |
| Ashoknagar district population | 845,071 |
| Guna district population | 1,241,519 |
| Balaghat district population | 1,701,698 |
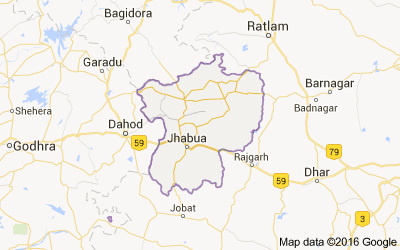
Jhabua district Map
Reference
- Census 2011 Data - censusindia.gov.in
- Jhabua, Madhya Pradesh - Wikipedia