Kendrapara District Population, Caste, Religion Data (Odisha) - Census 2011
Kendrapara district of Odisha has a total population of 1,440,361 as per the Census 2011. Out of which 717,814 are males while 722,547 are females. In 2011 there were a total 321,934 families residing in Kendrapara district. The Average Sex Ratio of Kendrapara district is 1,007.
As per Census 2011 out of total population, 5.8% people live in Urban areas while 94.2% live in the Rural areas. The average literacy rate in urban areas is 88.3% while that in rural areas is 85%. Also the Sex Ratio of Urban areas in Kendrapara district is 954 while that of Rural areas is 1,010.
The population of Children of age 0-6 years in Kendrapara district is 161159 which is 11% of the total population. There are 83654 male children and 77505 female children between the age 0-6 years. Thus as per the Census 2011 the Child Sex Ratio of Kendrapara is 926 which is less than Average Sex Ratio (1,007) of Kendrapara district.
The total literacy rate of Kendrapara district is 85.15%. The male literacy rate is 80.8% and the female literacy rate is 70.49% in Kendrapara district.
To facilitate the administration, Kendrapara district is further divided into 12 Blocks (Taluka/Tehsil/Tahsil) which are administrative divisions denoting sub-districts. Blocks consists of multiple villages and a few towns.
Kendrapara Data as per Census 2011
As per the Population Census 2011 data, following are some quick facts about Kendrapara district.
| Total | Male | Female | |
|---|---|---|---|
| Children (Age 0-6) | 161,159 | 83,654 | 77,505 |
| Literacy | 85.15% | 80.8% | 70.49% |
| Scheduled Caste | 309,780 | 155,531 | 154,249 |
| Scheduled Tribe | 9,484 | 4,748 | 4,736 |
| Illiterate | 351,096 | 137,844 | 213,252 |
Caste-wise Population - Kendrapara district
Schedule Caste (SC) constitutes 21.5% while Schedule Tribe (ST) were 0.7% of total population in Kendrapara district of Odisha.
| Total | Male | Female | |
|---|---|---|---|
| Schedule Caste | 309,780 | 155,531 | 154,249 |
| Schedule Tribe | 9,484 | 4,748 | 4,736 |
Religion-wise Population - Kendrapara district
| Religion | Total | Male | Female | |
|---|---|---|---|---|
| Hindu | 1,386,792 | (96.28%) | 691,200 | 695,592 |
| Muslim | 50,247 | (3.49%) | 24,932 | 25,315 |
| Christian | 1,423 | (0.1%) | 730 | 693 |
| Sikh | 169 | (0.01%) | 71 | 98 |
| Buddhist | 62 | (0%) | 24 | 38 |
| Jain | 52 | (0%) | 29 | 23 |
| Other Religion | 24 | (0%) | 15 | 9 |
| No Religion Specified | 1,592 | (0.11%) | 813 | 779 |
Literacy Rate - Kendrapara district
The total literacy rate of Kendrapara district was 85.15% in 2011 which is greater than average literacy rate 72.87% of Odisha. Population-wise, out of total 1,089,265 literates, males were 579,970 while females were 509,295. Also the male literacy rate was 91.45% and the female literacy rate was 78.96% in Kendrapara district.
| Kendrapara district | Odisha | |
|---|---|---|
| Female | 78.96% | 64.01% |
| Male | 91.45% | 81.59% |
| Total | 85.15% | 72.87% |
Sex Ratio - Kendrapara district
The Sex Ratio of Kendrapara district is 1,007 . Thus for every 1000 men there were 1,007 females in Kendrapara district. Also as per Census 2011, the Child Sex Ration was 926 which is less than Average Sex Ratio ( 1,007 ) of Kendrapara district.
Population Density - Kendrapara district
The total area of Kendrapara district is 2,644 km2. Thus the density of Kendrapara district is 545 people per square kilometer. As per the initial provisional data of Census 2011, around 13 sq. km. area is under urban region while 2,631 sq. km. is under rural region.
Urban/Rural Population - Kendrapara district
As per the Census 2011 out of total population of Kendrapara, 5.8% people lived in urban regions while 94.2% in rural areas. The total urban population was 83,534 out of which 42,761 were males while the remaining 40,773 were females. In rural areas of Kendrapara, male population was 675,053 while the female population was 681,774.
The average sex ratio in urban regions of Kendrapara was 954 females per 1000 males. Also the Child (0-6 age) sex ration of urban areas in Kendrapara was 897 girls per 1000 boys. Thus the total children (0-6 age) living in urban areas of Kendrapara were 9,021 which is 10.8% of total urban population. Similarly the average sex ratio in rural areas of Kendrapara was 1,010 females per 1000 males. The Child sex ratio of rural areas in Kendrapara was 928 girls per 1000 boys.
The average literacy rate in Kendrapara for urban regions was 88.28 percent in which males were 92.65% literate while female literacy stood at 83.73%. The total literate population of Kendrapara was 1,089,265. Similarly in rural areas of Kendrapara, the average literacy rate was 84.96 percent. Out of which the literacy rate of males and females stood at 91.38% and 78.67% respectively. Total literates in rural areas of Kendrapara were 1,023,485.
| Rural | Urban | |
|---|---|---|
| Population % | 94.2% | 5.8% |
| Total population | 1,356,827 | 83,534 |
| Male population | 675,053 | 42,761 |
| Female population | 681,774 | 40,773 |
| Sex ratio | 1,010 | 954 |
| Child sex ratio (0-6 age) | 928 | 897 |
| Child population | 152,138 | 9,021 |
| Literates | 1,023,485 | 65,780 |
| Average literacy | 84.96% | 88.28% |
| Male literacy | 91.38% | 92.65% |
| Female literacy | 78.67% | 83.73% |
Child Population - Kendrapara district
According to Census 2011, there were 161,159 children between age 0 to 6 years in Kendrapara district. Out of which 83,654 were male while 77,505 were female.
Working Population - Kendrapara district
In Kendrapara district out of total population, 466,890 were engaged in work activities. 69% of workers describe their work as Main Work (Employment or Earning more than 6 Months) while 31% were involved in Marginal activity providing livelihood for less than 6 months. Of 466,890 workers engaged in Main Work, 122,975 were cultivators (owner or co-owner) while 70,136 were Agricultural labourers.
| Total | Male | Female | |
|---|---|---|---|
| Main Workers | 322,265 | 295,890 | 26,375 |
| Cultivators | 122,975 | 119,443 | 3,532 |
| Agriculture Labourer | 70,136 | 65,120 | 5,016 |
| Household Industries | 9,261 | 8,045 | 1,216 |
| Other Workers | 119,893 | 103,282 | 16,611 |
| Marginal Workers | 144,625 | 90,492 | 54,133 |
| Non Working | 973,471 | 331,432 | 642,039 |
Nearby Districts from Kendrapara
Below are the list of Districts near Kendrapara district in Odisha.
| District | Population |
|---|---|
| Bhadrak district population | 1,506,337 |
| Jagatsinghapur district population | 1,136,971 |
| Cuttack district population | 2,624,470 |
| Baleshwar district population | 2,320,529 |
| Mayurbhanj district population | 2,519,738 |
| Jajapur district population | 1,827,192 |
| Kendujhar district population | 1,801,733 |
| Dhenkanal district population | 1,192,811 |
| Sundargarh district population | 2,093,437 |
| Anugul district population | 1,273,821 |
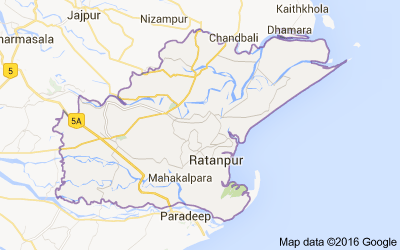
Kendrapara district Map
Reference
- Census 2011 Data - censusindia.gov.in
- Kendrapara, Odisha - Wikipedia