Patna District Population, Caste, Religion Data (Bihar) - Census 2011
Patna district of Bihar has a total population of 5,838,465 as per the Census 2011. Out of which 3,078,512 are males while 2,759,953 are females. In 2011 there were a total 975,578 families residing in Patna district. The Average Sex Ratio of Patna district is 897.
As per Census 2011 out of total population, 43.1% people live in Urban areas while 56.9% live in the Rural areas. The average literacy rate in urban areas is 81% while that in rural areas is 62.4%. Also the Sex Ratio of Urban areas in Patna district is 887 while that of Rural areas is 904.
The population of Children of age 0-6 years in Patna district is 943552 which is 16% of the total population. There are 494228 male children and 449324 female children between the age 0-6 years. Thus as per the Census 2011 the Child Sex Ratio of Patna is 909 which is greater than Average Sex Ratio (897) of Patna district.
The total literacy rate of Patna district is 70.68%. The male literacy rate is 65.88% and the female literacy rate is 51.87% in Patna district.
To facilitate the administration, Patna district is further divided into 23 Blocks (Taluka/Tehsil/Tahsil) which are administrative divisions denoting sub-districts. Blocks consists of multiple villages and a few towns.
Patna Data as per Census 2011
As per the Population Census 2011 data, following are some quick facts about Patna district.
| Total | Male | Female | |
|---|---|---|---|
| Children (Age 0-6) | 943,552 | 494,228 | 449,324 |
| Literacy | 70.68% | 65.88% | 51.87% |
| Scheduled Caste | 920,918 | 482,088 | 438,830 |
| Scheduled Tribe | 9,069 | 4,717 | 4,352 |
| Illiterate | 2,378,786 | 1,050,465 | 1,328,321 |
Caste-wise Population - Patna district
Schedule Caste (SC) constitutes 15.8% while Schedule Tribe (ST) were 0.2% of total population in Patna district of Bihar.
| Total | Male | Female | |
|---|---|---|---|
| Schedule Caste | 920,918 | 482,088 | 438,830 |
| Schedule Tribe | 9,069 | 4,717 | 4,352 |
Religion-wise Population - Patna district
| Religion | Total | Male | Female | |
|---|---|---|---|---|
| Hindu | 5,356,075 | (91.74%) | 2,828,753 | 2,527,322 |
| Muslim | 439,952 | (7.54%) | 227,997 | 211,955 |
| Christian | 12,551 | (0.21%) | 6,154 | 6,397 |
| Sikh | 4,803 | (0.08%) | 2,533 | 2,270 |
| Buddhist | 1,062 | (0.02%) | 572 | 490 |
| Jain | 2,151 | (0.04%) | 1,129 | 1,022 |
| Other Religion | 203 | (0%) | 100 | 103 |
| No Religion Specified | 21,668 | (0.37%) | 11,274 | 10,394 |
Literacy Rate - Patna district
The total literacy rate of Patna district was 70.68% in 2011 which is greater than average literacy rate 61.8% of Bihar. Population-wise, out of total 3,459,679 literates, males were 2,028,047 while females were 1,431,632. Also the male literacy rate was 78.48% and the female literacy rate was 61.96% in Patna district.
| Patna district | Bihar | |
|---|---|---|
| Female | 61.96% | 51.5% |
| Male | 78.48% | 71.2% |
| Total | 70.68% | 61.8% |
Sex Ratio - Patna district
The Sex Ratio of Patna district is 897 . Thus for every 1000 men there were 897 females in Patna district. Also as per Census 2011, the Child Sex Ration was 909 which is greater than Average Sex Ratio ( 897 ) of Patna district.
Population Density - Patna district
The total area of Patna district is 3,202 km2. Thus the density of Patna district is 1,823 people per square kilometer. As per the initial provisional data of Census 2011, around 270 sq. km. area is under urban region while 2,932 sq. km. is under rural region.
Urban/Rural Population - Patna district
As per the Census 2011 out of total population of Patna, 43.07% people lived in urban regions while 56.93% in rural areas. The total urban population was 2,514,590 out of which 1,332,487 were males while the remaining 1,182,103 were females. In rural areas of Patna, male population was 1,746,025 while the female population was 1,577,850.
The average sex ratio in urban regions of Patna was 887 females per 1000 males. Also the Child (0-6 age) sex ration of urban areas in Patna was 883 girls per 1000 boys. Thus the total children (0-6 age) living in urban areas of Patna were 329,592 which is 13.11% of total urban population. Similarly the average sex ratio in rural areas of Patna was 904 females per 1000 males. The Child sex ratio of rural areas in Patna was 923 girls per 1000 boys.
The average literacy rate in Patna for urban regions was 80.98 percent in which males were 85.75% literate while female literacy stood at 75.59%. The total literate population of Patna was 3,459,679. Similarly in rural areas of Patna, the average literacy rate was 62.38 percent. Out of which the literacy rate of males and females stood at 72.57% and 51.04% respectively. Total literates in rural areas of Patna were 1,690,372.
| Rural | Urban | |
|---|---|---|
| Population % | 56.93% | 43.07% |
| Total population | 3,323,875 | 2,514,590 |
| Male population | 1,746,025 | 1,332,487 |
| Female population | 1,577,850 | 1,182,103 |
| Sex ratio | 904 | 887 |
| Child sex ratio (0-6 age) | 923 | 883 |
| Child population | 613,960 | 329,592 |
| Literates | 1,690,372 | 1,769,307 |
| Average literacy | 62.38% | 80.98% |
| Male literacy | 72.57% | 85.75% |
| Female literacy | 51.04% | 75.59% |
Child Population - Patna district
According to Census 2011, there were 943,552 children between age 0 to 6 years in Patna district. Out of which 494,228 were male while 449,324 were female.
Working Population - Patna district
In Patna district out of total population, 1,881,886 were engaged in work activities. 72.9% of workers describe their work as Main Work (Employment or Earning more than 6 Months) while 27.1% were involved in Marginal activity providing livelihood for less than 6 months. Of 1,881,886 workers engaged in Main Work, 221,694 were cultivators (owner or co-owner) while 399,689 were Agricultural labourers.
| Total | Male | Female | |
|---|---|---|---|
| Main Workers | 1,371,267 | 1,121,391 | 249,876 |
| Cultivators | 221,694 | 191,342 | 30,352 |
| Agriculture Labourer | 399,689 | 297,656 | 102,033 |
| Household Industries | 57,337 | 40,054 | 17,283 |
| Other Workers | 692,547 | 592,339 | 100,208 |
| Marginal Workers | 510,619 | 315,020 | 195,599 |
| Non Working | 3,956,579 | 1,642,101 | 2,314,478 |
Nearby Districts from Patna
Below are the list of Districts near Patna district in Bihar.
| District | Population |
|---|---|
| Nalanda district population | 2,877,653 |
| Bhojpur district population | 2,728,407 |
| Buxar district population | 1,706,352 |
| Sheikhpura district population | 636,342 |
| Kaimur district population | 1,626,384 |
| Lakhisarai district population | 1,000,912 |
| Rohtas district population | 2,959,918 |
| Munger district population | 1,367,765 |
| Aurangabad district population | 2,540,073 |
| Banka district population | 2,034,763 |
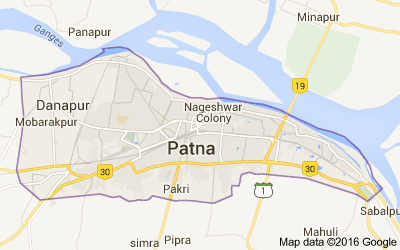
Patna district Map
Reference
- Census 2011 Data - censusindia.gov.in
- Patna, Bihar - Wikipedia