Tiruppur District Population, Caste, Religion Data (Tamil Nadu) - Census 2011
Tiruppur district of Tamil Nadu has a total population of 2,479,052 as per the Census 2011. Out of which 1,246,159 are males while 1,232,893 are females. In 2011 there were a total 712,210 families residing in Tiruppur district. The Average Sex Ratio of Tiruppur district is 989.
As per Census 2011 out of total population, 61.4% people live in Urban areas while 38.6% live in the Rural areas. The average literacy rate in urban areas is 84.5% while that in rural areas is 69.6%. Also the Sex Ratio of Urban areas in Tiruppur district is 984 while that of Rural areas is 999.
The population of Children of age 0-6 years in Tiruppur district is 241351 which is 10% of the total population. There are 123612 male children and 117739 female children between the age 0-6 years. Thus as per the Census 2011 the Child Sex Ratio of Tiruppur is 952 which is less than Average Sex Ratio (989) of Tiruppur district.
The total literacy rate of Tiruppur district is 78.68%. The male literacy rate is 77.01% and the female literacy rate is 64.96% in Tiruppur district.
To facilitate the administration, Tiruppur district is further divided into 7 Talukas (Taluka/Tehsil/Tahsil) which are administrative divisions denoting sub-districts. Talukas consists of multiple villages and a few towns.
Tiruppur Data as per Census 2011
As per the Population Census 2011 data, following are some quick facts about Tiruppur district.
| Total | Male | Female | |
|---|---|---|---|
| Children (Age 0-6) | 241,351 | 123,612 | 117,739 |
| Literacy | 78.68% | 77.01% | 64.96% |
| Scheduled Caste | 395,876 | 196,907 | 198,969 |
| Scheduled Tribe | 5,458 | 2,740 | 2,718 |
| Illiterate | 718,486 | 286,536 | 431,950 |
Caste-wise Population - Tiruppur district
Schedule Caste (SC) constitutes 16% while Schedule Tribe (ST) were 0.2% of total population in Tiruppur district of Tamil Nadu.
| Total | Male | Female | |
|---|---|---|---|
| Schedule Caste | 395,876 | 196,907 | 198,969 |
| Schedule Tribe | 5,458 | 2,740 | 2,718 |
Religion-wise Population - Tiruppur district
| Religion | Total | Male | Female | |
|---|---|---|---|---|
| Hindu | 2,278,835 | (91.92%) | 1,146,733 | 1,132,102 |
| Muslim | 123,983 | (5%) | 61,835 | 62,148 |
| Christian | 70,015 | (2.82%) | 34,509 | 35,506 |
| Sikh | 455 | (0.02%) | 282 | 173 |
| Buddhist | 198 | (0.01%) | 109 | 89 |
| Jain | 371 | (0.01%) | 195 | 176 |
| Other Religion | 119 | (0%) | 62 | 57 |
| No Religion Specified | 5,076 | (0.2%) | 2,434 | 2,642 |
Literacy Rate - Tiruppur district
The total literacy rate of Tiruppur district was 78.68% in 2011 which is less than average literacy rate 80.09% of Tamil Nadu. Population-wise, out of total 1,760,566 literates, males were 959,623 while females were 800,943. Also the male literacy rate was 85.49% and the female literacy rate was 71.82% in Tiruppur district.
| Tiruppur district | Tamil Nadu | |
|---|---|---|
| Female | 71.82% | 73.44% |
| Male | 85.49% | 86.77% |
| Total | 78.68% | 80.09% |
Sex Ratio - Tiruppur district
The Sex Ratio of Tiruppur district is 989 . Thus for every 1000 men there were 989 females in Tiruppur district. Also as per Census 2011, the Child Sex Ration was 952 which is less than Average Sex Ratio ( 989 ) of Tiruppur district.
Population Density - Tiruppur district
The total area of Tiruppur district is 5,187 km2. Thus the density of Tiruppur district is 478 people per square kilometer. As per the initial provisional data of Census 2011, around 833 sq. km. area is under urban region while 4,354 sq. km. is under rural region.
Urban/Rural Population - Tiruppur district
As per the Census 2011 out of total population of Tiruppur, 61.36% people lived in urban regions while 38.64% in rural areas. The total urban population was 1,521,111 out of which 766,850 were males while the remaining 754,261 were females. In rural areas of Tiruppur, male population was 479,309 while the female population was 478,632.
The average sex ratio in urban regions of Tiruppur was 984 females per 1000 males. Also the Child (0-6 age) sex ration of urban areas in Tiruppur was 954 girls per 1000 boys. Thus the total children (0-6 age) living in urban areas of Tiruppur were 161,564 which is 10.62% of total urban population. Similarly the average sex ratio in rural areas of Tiruppur was 999 females per 1000 males. The Child sex ratio of rural areas in Tiruppur was 949 girls per 1000 boys.
The average literacy rate in Tiruppur for urban regions was 84.53 percent in which males were 90.06% literate while female literacy stood at 78.93%. The total literate population of Tiruppur was 1,760,566. Similarly in rural areas of Tiruppur, the average literacy rate was 69.61 percent. Out of which the literacy rate of males and females stood at 78.34% and 60.91% respectively. Total literates in rural areas of Tiruppur were 611,317.
| Rural | Urban | |
|---|---|---|
| Population % | 38.64% | 61.36% |
| Total population | 957,941 | 1,521,111 |
| Male population | 479,309 | 766,850 |
| Female population | 478,632 | 754,261 |
| Sex ratio | 999 | 984 |
| Child sex ratio (0-6 age) | 949 | 954 |
| Child population | 79,787 | 161,564 |
| Literates | 611,317 | 1,149,249 |
| Average literacy | 69.61% | 84.53% |
| Male literacy | 78.34% | 90.06% |
| Female literacy | 60.91% | 78.93% |
Child Population - Tiruppur district
According to Census 2011, there were 241,351 children between age 0 to 6 years in Tiruppur district. Out of which 123,612 were male while 117,739 were female.
Working Population - Tiruppur district
In Tiruppur district out of total population, 1,266,137 were engaged in work activities. 92.3% of workers describe their work as Main Work (Employment or Earning more than 6 Months) while 7.7% were involved in Marginal activity providing livelihood for less than 6 months. Of 1,266,137 workers engaged in Main Work, 130,331 were cultivators (owner or co-owner) while 216,945 were Agricultural labourers.
| Total | Male | Female | |
|---|---|---|---|
| Main Workers | 1,168,596 | 772,253 | 396,343 |
| Cultivators | 130,331 | 79,024 | 51,307 |
| Agriculture Labourer | 216,945 | 107,791 | 109,154 |
| Household Industries | 36,139 | 20,250 | 15,889 |
| Other Workers | 785,181 | 565,188 | 219,993 |
| Marginal Workers | 97,541 | 47,530 | 50,011 |
| Non Working | 1,212,915 | 426,376 | 786,539 |
Nearby Districts from Tiruppur
Below are the list of Districts near Tiruppur district in Tamil Nadu.
| District | Population |
|---|---|
| Coimbatore district population | 3,458,045 |
| Krishnagiri district population | 1,879,809 |
| Dharmapuri district population | 1,506,843 |
| Kanniyakumari district population | 1,870,374 |
| Tirunelveli district population | 3,077,233 |
| Thoothukkudi district population | 1,750,176 |
| Ramanathapuram district population | 1,353,445 |
| Virudhunagar district population | 1,942,288 |
| Theni district population | 1,245,899 |
| Madurai district population | 3,038,252 |
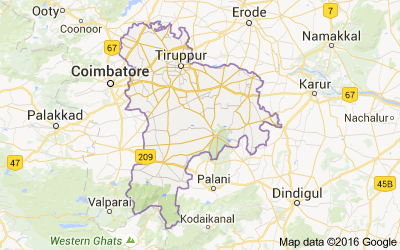
Tiruppur district Map
Reference
- Census 2011 Data - censusindia.gov.in
- Tiruppur, Tamil Nadu - Wikipedia