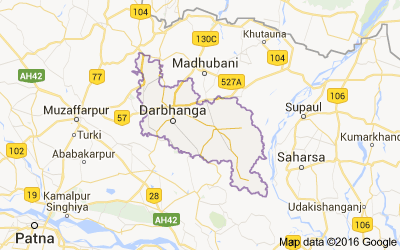
Blocks in Darbhanga district, Bihar - Census 2011

List of all Blocks in Darbhanga district of Bihar. Click on the Block name to get complete details villages and towns with Population, Caste, Religion, Literacy, Sex Ration data.
The total population of Darbhanga District is 3,937,385 out of which urban population is 383,328 while rural is 3,554,057. As per Census 2011, total families in Darbhanga district were 73,912. Check out important data about Darbhanga district as per Census 2011.
Darbhanga District data as per Census 2011
| Total | Rural | Urban | |
|---|---|---|---|
| Population | 3,937,385 | 3,554,057 | 383,328 |
| Children (0-6 years) | 725,482 | 668,296 | 57,186 |
| Literacy | 56.56% | 54.4% | 75.65% |
| Sex Ratio | 911 | 912 | 903 |
| Scheduled Caste | 15.6% | 16.1% | 11.7% |
| Scheduled Tribe | 0.1% | 0.1% | 0.1% |
List of Blocks in Darbhanga district
Below is list of all Blocks in Darbhanga district with important data such as Population, Literacy rate and Sex Ratio.
| # | Block | Towns & Villages | Population | Literacy | Sex Ratio |
|---|---|---|---|---|---|
| 1 | Alinagar | Towns & Villages | 143,797 | 39.8% | 928 |
| 2 | Bahadurpur | Towns & Villages | 261,805 | 47.4% | 891 |
| 3 | Baheri | Towns & Villages | 302,645 | 46.1% | 899 |
| 4 | Benipur | Towns & Villages | 250,357 | 48% | 916 |
| 5 | Biraul | Towns & Villages | 286,113 | 43% | 916 |
| 6 | Darbhanga | Towns & Villages | 577,036 | 57.1% | 898 |
| 7 | Ghanshyampur | Towns & Villages | 133,210 | 44.3% | 920 |
| 8 | Gora Bauram | Towns & Villages | 152,112 | 38.4% | 930 |
| 9 | Hanumannagar | Towns & Villages | 154,631 | 45.5% | 883 |
| 10 | Hayaghat | Towns & Villages | 148,081 | 48.8% | 893 |
| 11 | Jale | Towns & Villages | 264,248 | 43.2% | 937 |
| 12 | Keotiranway | Towns & Villages | 270,722 | 44.5% | 905 |
| 13 | Kiratpur | Towns & Villages | 81,423 | 38.9% | 918 |
| 14 | Kusheshwar Asthan | Towns & Villages | 162,870 | 40% | 917 |
| 15 | Kusheshwar Asthan Purbi | Towns & Villages | 128,817 | 33.8% | 898 |
| 16 | Manigachhi | Towns & Villages | 228,618 | 47.8% | 925 |
| 17 | Singhwara | Towns & Villages | 267,601 | 44.8% | 935 |
| 18 | Tardih | Towns & Villages | 123,299 | 47.5% | 927 |