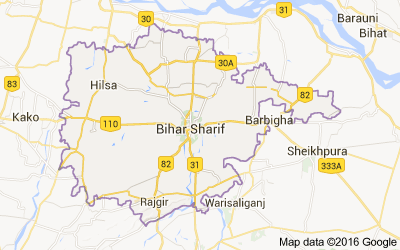
Blocks in Nalanda district, Bihar - Census 2011

List of all Blocks in Nalanda district of Bihar. Click on the Block name to get complete details villages and towns with Population, Caste, Religion, Literacy, Sex Ration data.
The total population of Nalanda District is 2,877,653 out of which urban population is 457,894 while rural is 2,419,759. As per Census 2011, total families in Nalanda district were 75,750. Check out important data about Nalanda district as per Census 2011.
Nalanda District data as per Census 2011
| Total | Rural | Urban | |
|---|---|---|---|
| Population | 2,877,653 | 2,419,759 | 457,894 |
| Children (0-6 years) | 518,681 | 446,213 | 72,468 |
| Literacy | 64.43% | 62.44% | 74.66% |
| Sex Ratio | 922 | 924 | 913 |
| Scheduled Caste | 21.1% | 22.9% | 11.5% |
| Scheduled Tribe | 0.1% | 0.1% | 0% |
List of Blocks in Nalanda district
Below is list of all Blocks in Nalanda district with important data such as Population, Literacy rate and Sex Ratio.
| # | Block | Towns & Villages | Population | Literacy | Sex Ratio |
|---|---|---|---|---|---|
| 1 | Asthawan | Towns & Villages | 163,938 | 48.4% | 939 |
| 2 | Ben | Towns & Villages | 87,387 | 53.4% | 919 |
| 3 | Bihar | Towns & Villages | 494,489 | 57.8% | 919 |
| 4 | Bind | Towns & Villages | 61,984 | 42.8% | 954 |
| 5 | Chandi | Towns & Villages | 152,156 | 52.9% | 923 |
| 6 | Ekangarsarai | Towns & Villages | 171,214 | 57.6% | 916 |
| 7 | Giriak | Towns & Villages | 96,845 | 49.7% | 932 |
| 8 | Harnaut | Towns & Villages | 176,140 | 49.8% | 904 |
| 9 | Hilsa | Towns & Villages | 197,309 | 54.6% | 911 |
| 10 | Islampur | Towns & Villages | 232,337 | 54% | 921 |
| 11 | Karai Parsurai | Towns & Villages | 73,951 | 45.7% | 931 |
| 12 | Katrisarai | Towns & Villages | 41,821 | 53.2% | 943 |
| 13 | Nagar Nausa | Towns & Villages | 94,467 | 51.9% | 915 |
| 14 | Noorsarai | Towns & Villages | 172,351 | 52.7% | 924 |
| 15 | Parbalpur | Towns & Villages | 70,316 | 58.3% | 917 |
| 16 | Rahui | Towns & Villages | 144,040 | 49.6% | 948 |
| 17 | Rajgir | Towns & Villages | 130,183 | 52.4% | 913 |
| 18 | Sarmera | Towns & Villages | 97,083 | 44.1% | 919 |
| 19 | Silao | Towns & Villages | 151,249 | 52.6% | 925 |
| 20 | Tharthari | Towns & Villages | 68,393 | 49.9% | 911 |