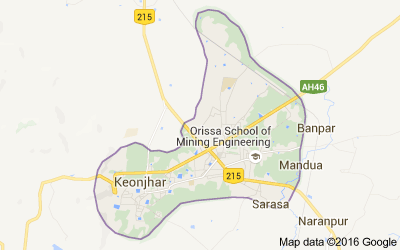
Blocks in Kendujhar district, Odisha - Census 2011

List of all Blocks in Kendujhar district of Odisha. Click on the Block name to get complete details villages and towns with Population, Caste, Religion, Literacy, Sex Ration data.
The total population of Kendujhar District is 1,801,733 out of which urban population is 253,059 while rural is 1,548,674. As per Census 2011, total families in Kendujhar district were 56,824. Check out important data about Kendujhar district as per Census 2011.
Kendujhar District data as per Census 2011
| Total | Rural | Urban | |
|---|---|---|---|
| Population | 1,801,733 | 1,548,674 | 253,059 |
| Children (0-6 years) | 259,403 | 224,941 | 34,462 |
| Literacy | 68.24% | 66.53% | 78.61% |
| Sex Ratio | 988 | 999 | 920 |
| Scheduled Caste | 11.6% | 11.2% | 14.4% |
| Scheduled Tribe | 45.4% | 49.1% | 23.3% |
List of Blocks in Kendujhar district
Below is list of all Blocks in Kendujhar district with important data such as Population, Literacy rate and Sex Ratio.
| # | Block | Towns & Villages | Population | Literacy | Sex Ratio |
|---|---|---|---|---|---|
| 1 | Anandapur | Towns & Villages | 124,218 | 60.4% | 981 |
| 2 | Bamebari | Towns & Villages | 56,271 | 43.5% | 956 |
| 3 | Barbil | Towns & Villages | 84,130 | 57.6% | 915 |
| 4 | Baria | Towns & Villages | 73,664 | 60.1% | 1,028 |
| 5 | Bolani | Towns & Villages | 19,993 | 55.2% | 940 |
| 6 | Champua | Towns & Villages | 97,117 | 58.4% | 992 |
| 7 | Daitari | Towns & Villages | 27,571 | 42.3% | 977 |
| 8 | Ghasipura | Towns & Villages | 112,740 | 65.1% | 984 |
| 9 | Ghatgaon | Towns & Villages | 107,106 | 56.3% | 1,003 |
| 10 | Harichandanpur | Towns & Villages | 80,711 | 54.5% | 996 |
| 11 | Jhumpura | Towns & Villages | 46,936 | 57% | 993 |
| 12 | Joda | Towns & Villages | 72,698 | 55.6% | 960 |
| 13 | Kanjipani | Towns & Villages | 21,741 | 32.1% | 1,023 |
| 14 | Kendujhar Sadar | Towns & Villages | 157,414 | 54.1% | 1,011 |
| 15 | Kendujhar Town | Towns & Villages | 98,880 | 70.8% | 942 |
| 16 | Nandipada | Towns & Villages | 82,542 | 76.5% | 971 |
| 17 | Nayakote | Towns & Villages | 46,056 | 33.1% | 1,034 |
| 18 | Pandapara | Towns & Villages | 63,308 | 56.3% | 1,002 |
| 19 | Patana | Towns & Villages | 104,824 | 56.5% | 1,027 |
| 20 | Rugudi | Towns & Villages | 16,560 | 48.9% | 880 |
| 21 | Sainkul | Towns & Villages | 78,693 | 72.2% | 976 |
| 22 | Soso | Towns & Villages | 64,244 | 62.3% | 991 |
| 23 | Telkoi | Towns & Villages | 95,718 | 56.2% | 1,010 |
| 24 | Turumunga | Towns & Villages | 68,598 | 61.1% | 1,015 |